Essay
A normal quartile plot is given below for the weekly incomes (in dollars)of a sample of
engineers in one town. Describe what each x value represents and what each y value
represents. Use the plot to assess the normality of the incomes of engineers in this town.
Explain your reasoning. 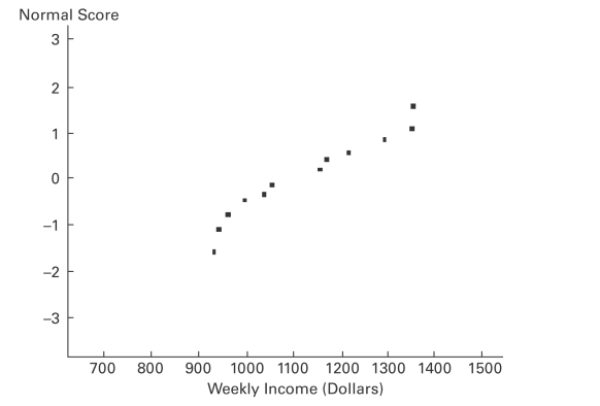
Correct Answer:

Verified
Each x-value is from the original set of...View Answer
Unlock this answer now
Get Access to more Verified Answers free of charge
Correct Answer:
Verified
View Answer
Unlock this answer now
Get Access to more Verified Answers free of charge
Q43: The probability that a radish seed will
Q44: The population of current statistics students
Q45: Which of the following is a biased
Q46: A study of the amount of time
Q46: The Precision Scientific Instrument Company manufactures thermometers
Q50: Assume that the weight loss for
Q52: In a population of 210 women,
Q53: Using the following uniform density curve, answer
Q54: Assume that the red blood cell counts
Q59: The number of books sold over the