Multiple Choice
Attendance records at a school show the number of days each student was absent during the_ year. The days absent for each student were as follows.
Which of these choices display the correct dotplot?
A) 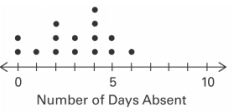
B) 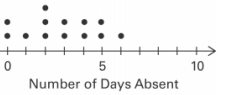
C) 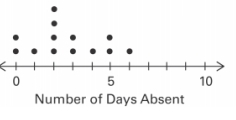
D) 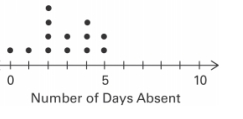
Correct Answer:

Verified
Correct Answer:
Verified
Related Questions
Q17: The histogram below represents the number of
Q18: The frequency distribution below summarizes employee
Q19: A nurse measured the blood pressure
Q21: Analysis of the data from 25
Q23: The frequency distribution below summarizes the
Q24: The frequency table below shows the
Q25: A nurse measured the blood pressure of
Q26: Wagenlucht Ice Cream Company is always trying
Q27: The following data set represents Heather's
Q50: Explain in your own words why a