Essay
Consider a situation where Y is related to X in the following manner:
Draw the deterministic part of the above function. Next add, in the same graph, a hypothetical Y, X scatterplot of the actual observations. Assume that you have misspecified the functional form of the regression function and estimated the relationship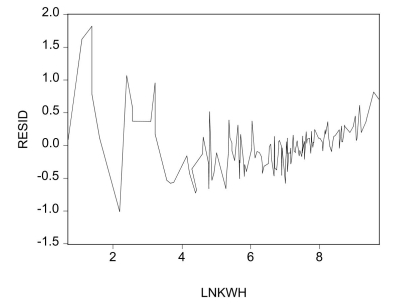
between Y and X using a linear regression function. Add this linear regression function to your graph. Separately, show what the plot of the residuals against the X variable in your regression would look like.
Correct Answer:

Verified
See the ac...View Answer
Unlock this answer now
Get Access to more Verified Answers free of charge
Correct Answer:
Verified
View Answer
Unlock this answer now
Get Access to more Verified Answers free of charge
Q5: Sample selection bias<br>A)occurs when a selection process
Q7: Possible solutions to omitted variable bias, when
Q31: You try to explain the number of
Q45: One of the most frequently used
Q46: Give at least three examples where
Q48: Your textbook has analyzed simultaneous equation
Q49: Until about 10 years ago, most studies
Q51: In the case of errors-in-variables bias,
Q53: A study of United States and Canadian
Q53: Explain why the OLS estimator for the