Essay
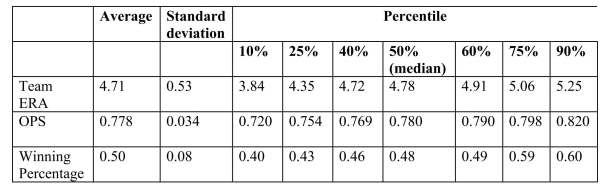
You have collected data from Major League Baseball (MLB)to find the determinants of
winning.You have a general idea that both good pitching and strong hitting are needed to do
well.However, you do not know how much each of these contributes separately.To
investigate this problem, you collect data for all MLB during 1999 season.Your strategy is to
first regress the winning percentage on pitching quality ("Team ERA"), second to regress the
same variable on some measure of hitting ("OPS - On-base Plus Slugging percentage"), and
third to regress the winning percentage on both.
(a)Use the t-statistic to test for the statistical significance of the coefficient.
Correct Answer:

Verified
Correct Answer:
Verified
Q2: A 95% confidence set for two or
Q3: If the absolute value of your calculated
Q4: The Solow growth model suggests that
Q6: The <span class="ql-formula" data-value="F"><span class="katex"><span
Q8: All of the following are true,
Q9: When testing the null hypothesis that
Q11: If you wanted to test, using
Q16: When your multiple regression function includes a
Q45: If the estimates of the coefficients of
Q57: The formula for the standard error of