Essay
The following two graphs give you a plot of the United States aggregate unemployment
rate for the sample period 1962:I to 1999:IV, and the (log)level of real United States
GDP for the sample period 1962:I to 1995:IV.You want test for stationarity in both
cases.Indicate whether or not you should include a time trend in your Augmented
Dickey-Fuller test and why. United States Unemployment Rate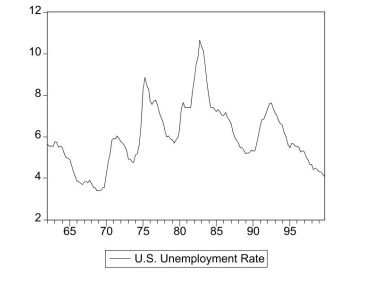
United States Real GDP (in logarithms)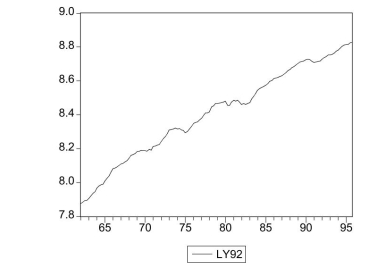
Correct Answer:

Verified
Looking over the entire sample period, t...View Answer
Unlock this answer now
Get Access to more Verified Answers free of charge
Correct Answer:
Verified
View Answer
Unlock this answer now
Get Access to more Verified Answers free of charge
Q2: To choose the number of lags in
Q2: An autoregression is a regression<br>A)of a dependent
Q3: (Requires Appendix Material) Define the difference
Q4: (Requires Appendix material): Show that the
Q4: Pseudo out of sample forecasting can be
Q7: Consider the following model <span
Q8: The time interval between observations can be
Q9: (Requires Appendix material) The long-run, stationary
Q11: You have decided to use the
Q20: Departures from stationarity<br>A)jeopardize forecasts and inference based