Multiple Choice
Solve the problem.
-The points shown in the graph represent the per capita consumption of chicken and beef in a country x years after the year 2000. Yearly Per Capita Consumption of Chicken and Beef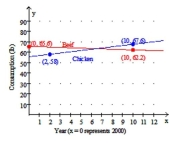
a. Use the given data points to write a linear function that approximates per capita consumption of Chicken C(x) (in lb) at a time x years since the year 2000.
b. Use the given data points to write a linear function that approximates per capita consumption of Beef B(x) (in lb) at a time x years since the year 2000.
c. Approximate the solution to the system of linear equations defined by the functions from parts (a)
And (b) . Round to 1 decimal place. Interpret the meaning of the solution to the system.
A) a.
b.
c. Midyear in 2,006 , the per capita consumption of beef and chicken was approximately equal at each
B) a. ;
b.
c. Midyear in 2,006 , the per capita consumption of beef and chicken was approximately equal at each
C) a.
b.
c. Midyear in 2,007 , the per capita consumption of beef and chicken was approximately equal at each
D) a. ;
b.
c. Midyear in 2,007 , the per capita consumption of beef and chicken was approximately equal at each
Correct Answer:

Verified
Correct Answer:
Verified
Q107: A system of equations that has no
Q108: Choose the one alternative that best
Q109: Write the word or phrase that best
Q110: Solve the problem.<br>-The number of adults
Q111: Solve the system of equations by
Q113: Solve the problem.<br>-Nail polish remover is essentially
Q114: Solve the system by using any
Q115: Solve the system. If a system
Q116: Choose the one alternative that best
Q117: Solve the problem.<br>-A closed box is