Multiple Choice
Plot the point on a rectangular coordinate system.
-The figure represents the average credit card debt for selected households in Silerville. 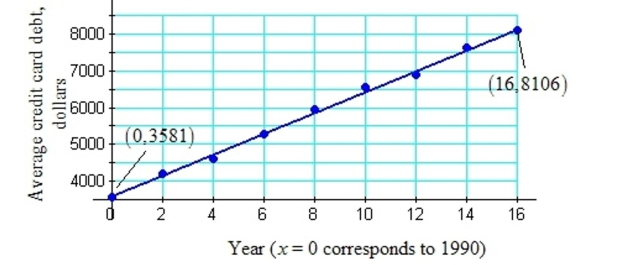
Let y represent the credit card debt in dollars. Let x represent the year, where x = 0 corresponds to the year 1990, x = 4 represents 1994, and so on.
a. Use the ordered pairs given in the graph, (0, 3581) and (16, 8106) to find a linear equation to estimate the
Average credit card debt versus the year. Round the slope to the nearest tenth.
b. Use the model from (a) to estimate the average debt in 2003. Round to the nearest dollar.
c. Interpret the slope of the model in the context of this problem.
A) a.
b. in 2003
c. The average household credit card debt is increasing at approximately per year.
B) а.
b. in 2003
c. The average household credit card debt is increasing at approximately per year.
C) a.
b. in 2003
c. The average household credit card debt is decreasing at approximately per year.
D) a.
b. in 2003
c. The average household credit card debt is decreasing at approximately per year.
Correct Answer:

Verified
Correct Answer:
Verified
Q322: Determine the slope of the line
Q323: Use the given information about a
Q324: Evaluate the function for the given
Q325: Evaluate as indicated.<br>-If <span class="ql-formula"
Q326: A _to an equation in the variables
Q328: Use the given information about a
Q329: Write the word or phrase that
Q330: Evaluate the function for the given
Q331: Find the indicated function and write
Q332: Write an equation of the line