Multiple Choice
Solve the problem.
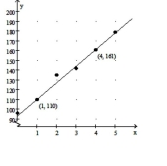
-The graph shows the number of organ transplants in a certain country for the years 2005 to 2010 where represents the number of years since 2005 .
The linear model was created using the points and .
a. Interpret the meaning of the slope in the context of this problem.
b. Interpret the meaning of the -intercept in the context of this problem.
A) a. means that more organ transplants were performed in 2009 than in 2006 .
b. The -intercept is and means that health officials predicted that
approximately 96 organ transplants would be performed in the year 2005 .
B) a. means that the number of organ transplants increased at an average rate of per yr during this time period.
b. The -intercept is and means that approximately 93 organ transplants were performed in the year 2005 .
C) a. means that the number of organ transplants increased at an average rate of per yr during this time period.
b. The -intercept is and means that approximately 96 organ transplants were performed in the year
D) a. means that more organ transplants were performed in 2009 than in 2006 .
b. The -intercept is and means that health officials predicted that approximately 93 organ transplants would be performed in the year
Correct Answer:

Verified
Correct Answer:
Verified
Q156: Write a function defined by y
Q157: Determine the slope of the line.<br>-<img
Q158: Find <span class="ql-formula" data-value="\frac {
Q159: Write the word or phrase that best
Q160: Solve the problem.<br>-Use interval notation to write
Q162: Write the word or phrase that best
Q163: Evaluate the function for the indicated
Q164: Evaluate the function for the given
Q165: Choose the one alternative that best
Q166: Write the word or phrase that best