Multiple Choice
Solve the problem.
-The graph shows the height h (in meters) of a roller coaster t seconds after the ride starts. 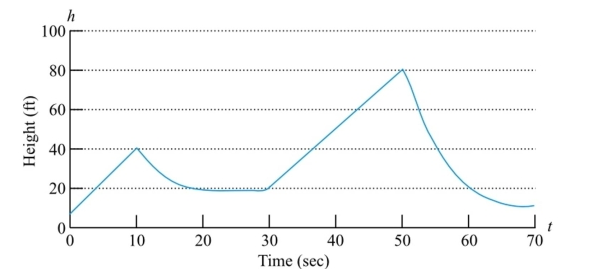
a. Over what interval(s) does the height increase?
b. Over what interval(s) does the height decrease?
A) a. and
b.
B) a.
b.
C) a.
b.
D) a. and
b. and
Correct Answer:

Verified
Correct Answer:
Verified
Q232: Choose the one alternative that best
Q233: Determine if the function is odd,
Q234: Solve the problem.<br>-If <span class="ql-formula"
Q235: Find the indicated function and write
Q236: Solve the problem.<br>-A student decides to
Q238: Choose the one alternative that best
Q239: Evaluate the function for the given
Q240: Choose the one alternative that best
Q241: Write the word or phrase that best
Q242: Find the indicated function and write