Multiple Choice
Produce a rule for the function whose graph is shown.
-A math tutor makes $15.00 per hour in the tutoring lab at her school. During final exam week, she earns overtime at $22.50 per hour for the work exceeding her normal 40-hr work week. Which
Graph best depicts her total salary for the week as a function of the number of hours worked?
A) 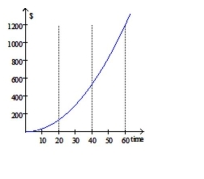
B) 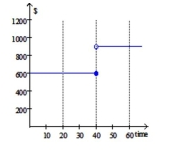
C) 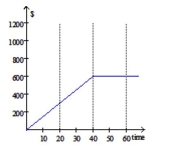
D) 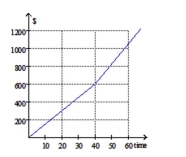
Correct Answer:

Verified
Correct Answer:
Verified
Q281: Evaluate as indicated.<br>-Find <span class="ql-formula"
Q282: Use transformations to graph the given
Q283: Solve the problem.<br>-A car accelerates from
Q284: Find the slope of the secant
Q285: Use the graph of y =
Q287: Identify the domain and range of
Q288: Use transformations to graph the given
Q289: Determine whether the relation defines y as
Q290: Determine the domain and range of
Q291: Use the given information to<br>a. Graph