Multiple Choice
A relative frequency histogram for the sale prices of homes sold in one city during 2010 is shown below. Basedon the histogram, is a large sample necessary to conduct a hypothesis test about the mean sale price? If so,why? 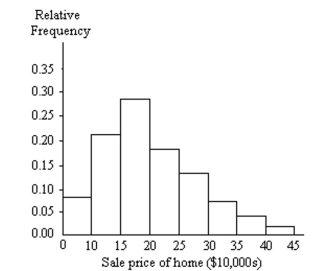
A) Yes; data do not appear to be normally distributed but skewed right.
B) Yes; data do not appear to be normally distributed but skewed left.
C) No; data appear to be normally distributed.
D) Yes; data do not appear to be normally distributed but bimodal.
Correct Answer:

Verified
Correct Answer:
Verified
Q120: Suppose you want to test the
Q121: Test the claim that <span
Q122: Use a t-test to test the
Q123: Use a t-test to test the
Q124: It is desired to test
Q126: The _ hypothesis contains the ʺ=ʺ sign.<br>A)
Q127: Determine the critical value for a right-tailed
Q128: A coin is tossed 1000 times and
Q129: The mean age of judges in Los
Q130: Determine the critical value for a right-tailed