Multiple Choice
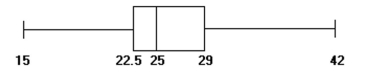
A) Yes; the data appear roughly normally distributed and there are no outliers
B) No; the data appear roughly normally distributed, but there are outliers
C) No; the data are not normally distributed and there are outliers
D) No; there are no outliers, but the data are not normally distributed
Correct Answer:

Verified
Correct Answer:
Verified
Q12: Construct a 90% confidence interval for the
Q13: A university dean is interested in
Q14: 95%<br>A) 1.96<br>B) 1.645<br>C) 0.83<br>D) 1.68
Q15: A college nurse obtained a random
Q16: A survey of 250 households showed 91
Q18: What is the best point estimate
Q19: When 385 junior college students were surveyed,170
Q20: The best point estimate for the
Q21: Many people think that a national lobbyʹs
Q22: To help consumers assess the risks they