Multiple Choice
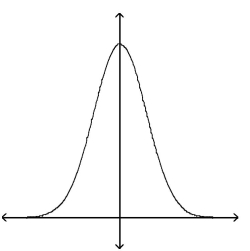
A) The graph can represent a normal density function.
B) The graph cannot represent a normal density function because it has no inflection points.
C) The graph cannot represent a normal density function because as x increases without bound, the graph takes negative values.
D) The graph cannot represent a normal density function because the area under the graph is greater than 1.
Correct Answer:

Verified
Correct Answer:
Verified
Q51: Find the area under the standard normal
Q60: Find the area under the standard normal
Q64: A new phone system was installed last
Q65: The length of time it takes college
Q66: Suppose a brewery has a filling machine
Q67: <img src="https://d2lvgg3v3hfg70.cloudfront.net/TB6004/.jpg" alt=" A) The graph
Q68: If sample data are taken from a
Q72: Assuming that all conditions are met
Q73: The graph of a normal curve
Q74: Find the z-score for which the area