Multiple Choice
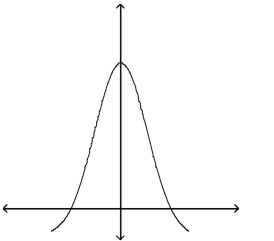
A) The graph cannot represent a normal density function because the graph takes negative values for some values of x.
B) The graph cannot represent a normal density function because the area under the graph is less than 1.
C) The graph cannot represent a normal density function because it is not symmetric.
D) The graph can represent a normal density function.
Correct Answer:

Verified
Correct Answer:
Verified
Q110: The amount of corn chips dispensed into
Q111: The length of time it takes college
Q112: The analytic scores on a standardized aptitude
Q113: The failure rate in a German class
Q114: The author of an economics book has
Q115: n = 80, p = 0.7, x
Q116: Find the z-score for which the area
Q118: A machine is set to pump cleanser
Q119: Compare a graph of the normal density
Q120: Assuming that all conditions are met