Multiple Choice
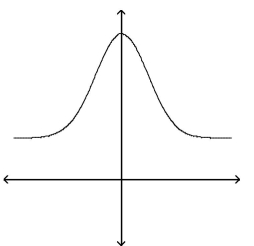
A) The graph cannot represent a normal density function because it does not approach the horizontal axis as x increases or decreases without bound.
B) The graph cannot represent a normal density function because it is not bell shaped.
C) The graph can represent a normal density function.
D) The graph cannot represent a normal density function because it has no inflection points.
Correct Answer:

Verified
Correct Answer:
Verified
Q10: Find the area under the standard normal
Q11: Find the z-score for which the area
Q14: You are performing a study about
Q16: The average mpg (miles per gallon)
Q17: Assume that the random variable X is
Q18: Determine whether the following normal probability plot
Q19: Assume that the random variable X is
Q20: True or False: In order to use
Q55: Find the z-scores for which 98% of
Q71: Find the area under the standard normal