Multiple Choice
Determine whether the following normal probability plot indicates that the sample data could have come froma population that is normally distributed. 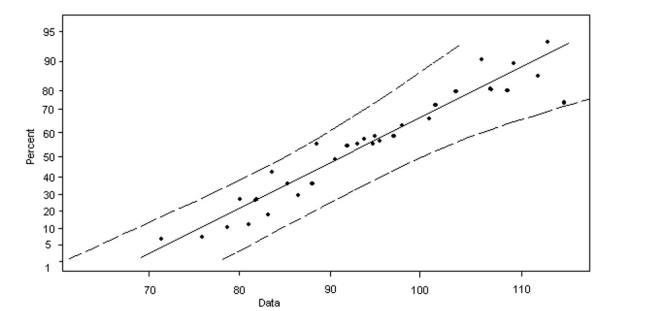
A) normally distributed
B) not normally distributed
Correct Answer:

Verified
Correct Answer:
Verified
Related Questions
Q46: A brewery has a beer dispensing machine
Q47: True or False: The area under the
Q48: Suppose x is a uniform random variable
Q49: High temperatures in a certain city for
Q51: z0.05<br>A) 1.645<br>B) -1.645<br>C) 0.52<br>D) 1.75
Q52: According to government data, the probability than
Q53: Find the area under the standard normal
Q54: True or False: In a uniform probability
Q73: Find the area under the standard normal
Q126: Find the area under the standard normal