Multiple Choice
Determine whether the following normal probability plot indicates that the sample data could have come froma population that is normally distributed. 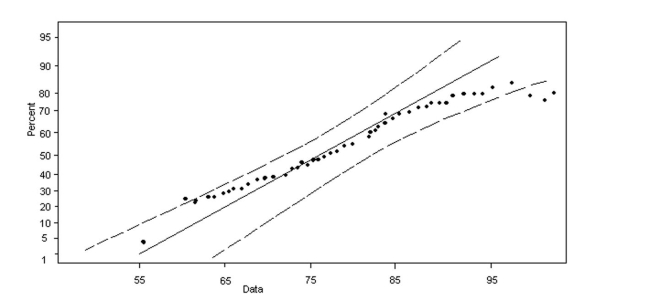
A) not normally distributed
B) normally distributed
Correct Answer:

Verified
Correct Answer:
Verified
Related Questions
Q91: A recent survey found that 73% of
Q92: Farmers often sell fruits and vegetables at
Q93: Find the area under the standard normal
Q95: A firm believes the internal rate of
Q97: A random number generator is set top
Q99: In a recent survey, 84% of the
Q100: Find the sum of the areas under
Q100: A normal probability plot is a graph
Q101: Find the z-score for which the area
Q137: Find the area under the standard normal