Essay
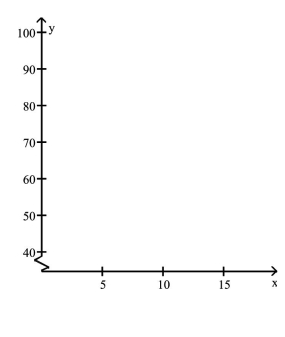
The data below represent the numbers of absences and the final grades of 15 randomly selected students froman astronomy class. Construct a scatter diagram for the data. Do you detect a trend? 
Correct Answer:

Verified
There appears to be a trend in...View Answer
Unlock this answer now
Get Access to more Verified Answers free of charge
Correct Answer:
Verified
View Answer
Unlock this answer now
Get Access to more Verified Answers free of charge
Q42: Find the equation of the regression
Q43: The data below are the final
Q44: The data below are the average
Q45: Find the equation of the regression
Q46: A history instructor has given the same
Q48: <span class="ql-formula" data-value="\begin{array} { c | c
Q49: <span class="ql-formula" data-value="\begin{array}{lrrrrrrr}\text { Subject } &
Q50: A manager wishes to determine the
Q51: Which scatter diagram indicates a perfect positive
Q52: A random sample of 200 men aged