Multiple Choice
The boxplot shown below was constructed in Excel for the amount of soda that was poured by a fillingmachine into 12-ounce soda cans at a local bottling company. 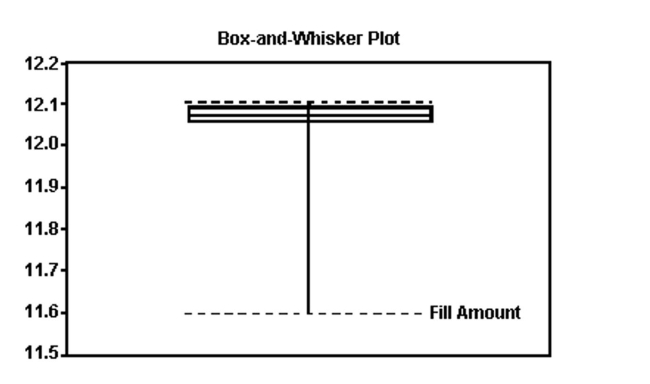 Based on the information given in the boxplot below, what shape do you believe the data to have?
A) skewed to the left
B) approximately symmetric
C) skewed to the right
D) cannot be determined
Correct Answer:

Verified
Correct Answer:
Verified
Q109: A statistic is said to be biased
Q110: The percentage of measurements that are above
Q111: A highly selective boarding school will only
Q112: A severe drought affected several western states
Q113: The cholesterol levels (in milligrams per
Q115: Each year advertisers spend billions of
Q116: Which measure of central tendency is not
Q117: A study was designed to investigate the
Q118: The amount of television viewed by todayʹs
Q119: The costs (in dollars) of 10 college