Multiple Choice
SAS was used to compare the high school dropout rates for the 30 school districts in one city in 2010 and 2012.The box plots generated for these dropout rates are shown below.Compare the center of the distributions and the variation of the distributions for the two years. 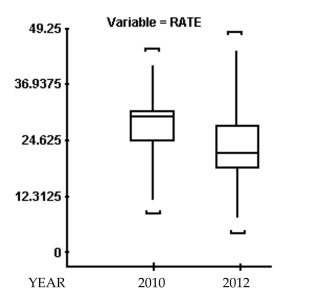
A) Dropout rates had a higher average with less variability in 2010 than in 2012.
B) Dropout rates had a higher average with more variability in 2010 than in 2012.
C) Dropout rates had a lower average with more variability in 2010 than in 2012.
D) Dropout rates had a lower average with less variability in 2010 than in 2012.
Correct Answer:

Verified
Correct Answer:
Verified
Q102: For the data set given below the
Q103: A random sample of sale prices
Q104: The following data represents a random
Q105: Given the following five-number summary, find the
Q106: At a tennis tournament a statistician keeps
Q108: A small computing center has found that
Q109: A statistic is said to be biased
Q110: The percentage of measurements that are above
Q111: A highly selective boarding school will only
Q112: A severe drought affected several western states