Multiple Choice
The Excel frequency bar graph below describes the employment status of a random sample of U.S. adults.What is the percentage of those having no job? 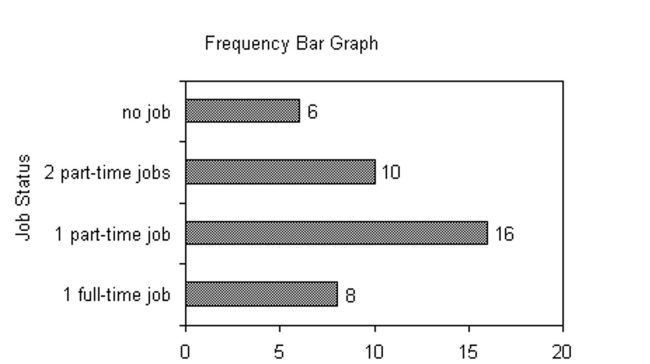
A) 15%
B) 20%
C) 40%
D) cannot determine
Correct Answer:

Verified
Correct Answer:
Verified
Related Questions
Q41: A transportation engineer wishes to use
Q42: For the stem-and-leaf plot below, what
Q43: Approximately how many tickets were sold during
Q44: <img src="https://d2lvgg3v3hfg70.cloudfront.net/TB6004/.jpg" alt=" A) skewed to
Q45: A two-pound bag of assorted candy contained
Q47: <img src="https://d2lvgg3v3hfg70.cloudfront.net/TB6004/.jpg" alt=" A) The vertical
Q48: The heights (in inches) of 30
Q49: The local police, using radar, checked
Q50: The grade point averages for 40
Q51: The results of a survey about