True/False
Use the information given in the chart or graph to determine the truth values of the simple statements. Then determine the truth value of the compound statement given.
-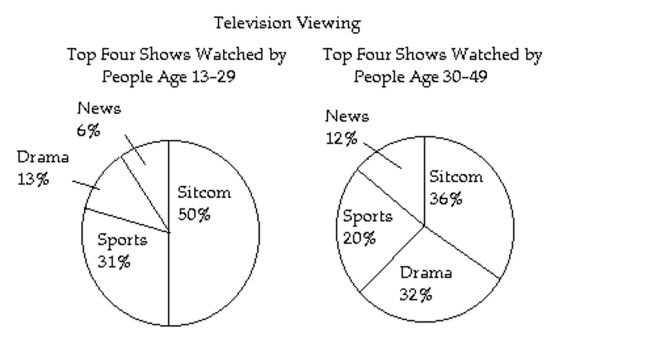
The most common type of TV show watched by 13-29 year-olds is the sitcom, or 31% of 13-29 year-olds watch sports and 20% of 30-49 year-olds watch sports.
Correct Answer:

Verified
Correct Answer:
Verified
Q183: Indicate whether the statement is a
Q184: Determine the truth value for each simple
Q185: Write the compound statement in symbols.
Q186: Given p is true, q is
Q187: Write the compound statement in symbols.
Q189: Determine which, if any, of the three
Q190: Write the compound statement in symbols.<br>Let
Q191: Convert the compound statement into words.<br>-
Q192: Use DeMorganʹs laws or a truth
Q193: Indicate whether the statement is a