Multiple Choice
Solve the problem.
-Use the following graph, which shows the sales of digital music players, in millions, at a national Electronics retail store for the years 2005-2012. Use the graph to represent the set in roster form. 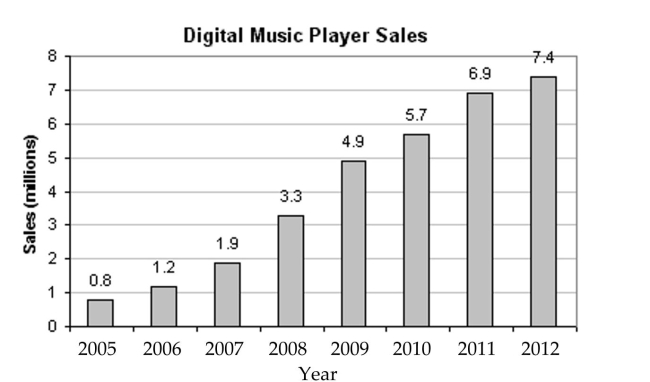
The set of years included in the graph in which digital music player sales were between 3 million And 5 million.
A) {2008, 2009}
B) {2008, 2009, 2010}
C) {2007, 2008, 2009}
D) {2009, 2010}
Correct Answer:

Verified
Correct Answer:
Verified
Q63: Identify the set as finite or infinite<br>-The
Q64: Express the set in roster form.<br>-{x|x is
Q65: List all subsets or determine the number
Q66: Determine whether the set is well defined
Q67: Find n(A) for the set.<br>-A = {x
Q69: Determine whether the sets are equal, equivalent,
Q70: For the given sets, construct a Venn
Q71: Determine whether the set is well defined
Q72: Let U = {all soda pops},
Q73: If the statement is true for