Multiple Choice
Solve the problem.
-Use the following graph, which shows the sales of digital music players, in millions, at a national Electronics retail store for the years 2005-2012. Use the graph to represent the set in roster form. 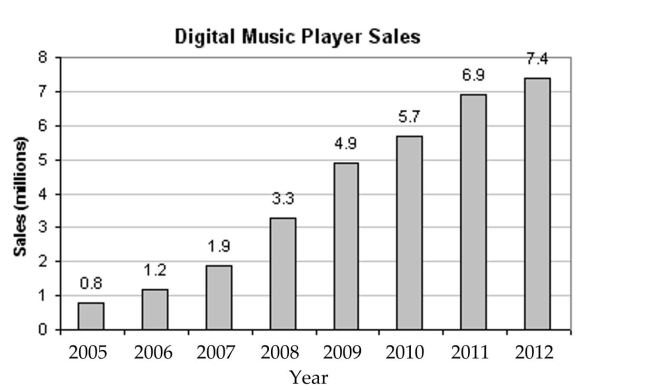
The set of years included in the graph in which digital music player sales were more than 18 Million.
A) {2005, 2006, 2007, 2008, 2009, 2010, 2011}
B) {0}
C) { }
D) {2005, 2006, 2007, 2008, 2009, 2010, 2011, 2012}
Correct Answer:

Verified
Correct Answer:
Verified
Q28: Express the set in roster form.<br>-{x|x is
Q29: Use <span class="ql-formula" data-value=" \subseteq,
Q30: Express the set in roster form.<br>-The set
Q31: If the statement is true for
Q32: Use <span class="ql-formula" data-value=" \subseteq,
Q34: Write a description of the set.<br>-E =
Q35: Write the set in set-builder notation.<br>-{2,
Q36: Determine whether the set is well defined
Q37: Find n(A) for the set.<br>-A = {x
Q38: Express the set in roster form.<br>-The set