Multiple Choice
Solve the problem.
-Use the following graph which shows the number of customer service calls to a major appliance Manufacturer, in millions, for the years 2006-2012. Use the graph to represent the set in roster Form. 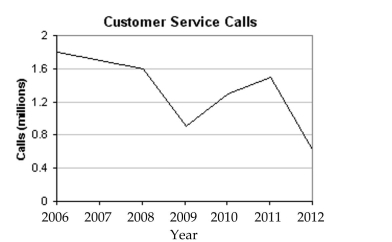
The set of years in which the number of customer service calls were below 1.1 million.
A) {2009, 2010, 2012}
B) {2009, 2012}
C) {2008, 2009, 2012}
D) {2012}
Correct Answer:

Verified
Correct Answer:
Verified
Q113: Determine whether the sets are equal, equivalent,
Q114: If the statement is true for
Q115: If the statement is true for
Q116: Let A = {1, 3, 5, 7}<br>B
Q117: List all subsets or determine the number
Q119: Write a description of the set.<br>-D =
Q120: Determine whether the number used is a
Q121: Write a description of the set.<br>-S =
Q122: Let U = {all soda pops},
Q123: Find n(A) for the set.<br>-A = {x∣x