Multiple Choice
Solve the problem.
-Use the following graph which shows the number of customer service calls to a major appliance Manufacturer, in millions, for the years 2006-2012. Use the graph to represent the set in roster Form. 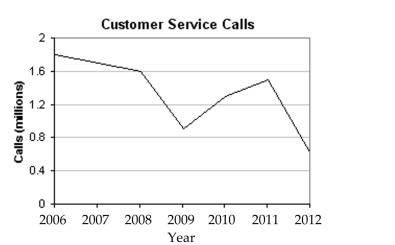
The set of years in which the number of customer service calls exceeded 1.1 million.
A) {2009, 2012}
B) {2006, 2007, 2008, 2010, 2011}
C) {2006, 2007, 2008, 2009, 2010, 2011}
D) {2006, 2007, 2008, 2011}
Correct Answer:

Verified
Correct Answer:
Verified
Q18: Determine whether the sets are equal, equivalent,
Q19: Write a description of the set.<br>-S =
Q20: If the statement is true for
Q21: Tell whether the statement is true or
Q22: Let A = {1, 3, 5, 7}<br>B
Q24: Determine whether the set is well defined
Q25: Determine whether the set is well defined
Q26: Tell whether the statement is true or
Q27: Find n(A) for the set.<br>-A = {800,
Q28: Express the set in roster form.<br>-{x|x is