Multiple Choice
Solve the problem. Where appropriate, round to the nearest tenth of a percent.
-The graph shows the number of cars (in thousands) produced by a car manufacturer in the years 1980, 1985, 1990, 1995, 2000, and 2005. Which five -year period saw the largest percent increase in Production? 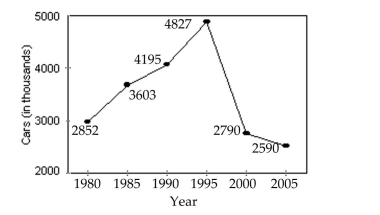
A) 1980 to 1995
B) 1980 to 1985
C) 1995 to 2000
D) 1990 to 1995
Correct Answer:

Verified
Correct Answer:
Verified
Q103: Solve the problem. Assume that simple
Q104: Find the simple interest. (The rate is
Q105: A partial payment is made on
Q106: Solve the problem.<br>-Brad invests $1500 in an
Q107: Write as a decimal.<br>- <span class="ql-formula"
Q109: Use the ordinary annuity formula to determine
Q110: Solve the problem.<br>-On the September 20 billing
Q111: Use the circle graph to answer the
Q112: A partial payment is made on
Q113: Use the ordinary annuity formula to determine