Essay
The table below presents some summary statistics from the distributions of the number of drones.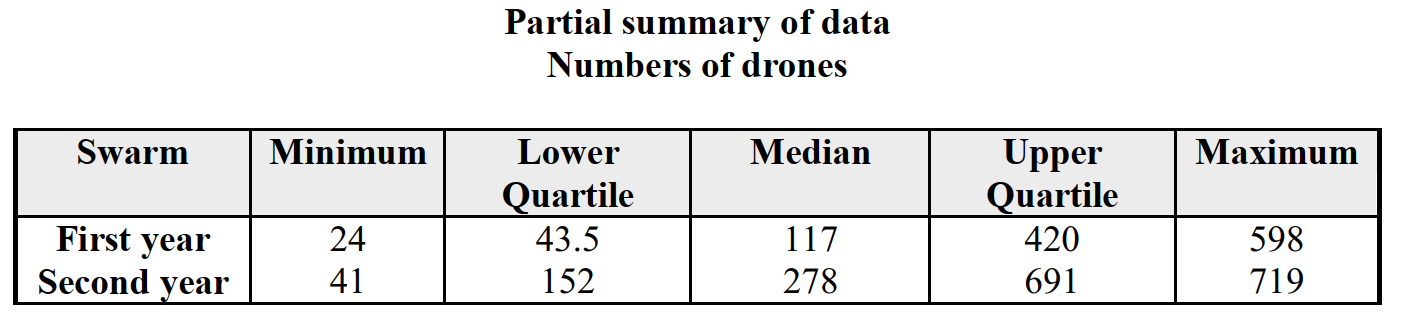
-Construct comparative box plots of the numbers of drones in the swarms in thefirst and second years. 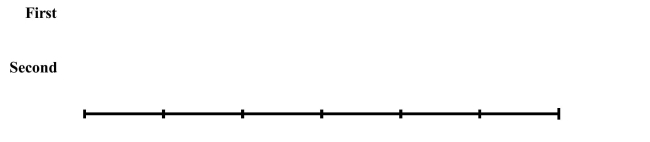
Correct Answer:

Verified
Correct Answer:
Verified
Related Questions
Q2: The mean is the middle value of
Q19: Multiple sclerosis (MS) is an autoimmune disease
Q20: s is a measure of the variability
Q21: The measurements in the table at right
Q22: The Economist is a weekly newspaper that
Q25: Grey Kangaroos are large social marsupials, indigenous
Q26: Multiple sclerosis (MS) is an autoimmune disease
Q27: Multiple sclerosis (MS) is an autoimmune disease
Q28: The forces that determine the size of
Q29: Higher vertebrates (mammals and birds) exhibit lateralized