Essay
The stem-and-leaf plot below displays the weights (in ounces) for a random sample oftomatoes grown on a local farm 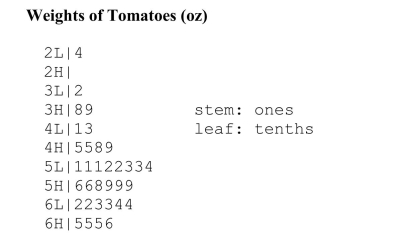
(a) Briefly describe the distribution of tomato weights.(b) What is the weight of the heaviest tomato in the sample?
Correct Answer:

Verified
a) This is moderately skewed in the nega...View Answer
Unlock this answer now
Get Access to more Verified Answers free of charge
Correct Answer:
Verified
View Answer
Unlock this answer now
Get Access to more Verified Answers free of charge
Q10: One of the "media messages" sent by
Q11: It is well known that the order
Q12: A univariate data set must contain numerical,
Q13: Information about the Spanish missions <img src="https://d2lvgg3v3hfg70.cloudfront.net/TB5309/.jpg"
Q14: A segmented bar chart uses rectangles rather
Q16: During the first six months of the
Q17: A report in the Des Moines Register
Q18: Hoofed animals such as cattle and sheep
Q19: The average circumferences (distances around) in mm
Q20: A unimodal set of data is one