Essay
Knowledge of where animals forage for food is essential for effective wildlifemanagement and conservation. The data below are foraging heights (in m) for asample of Mountain Chickadees. The data are taken from two different species of firtrees: the Douglas fir and the White fir. 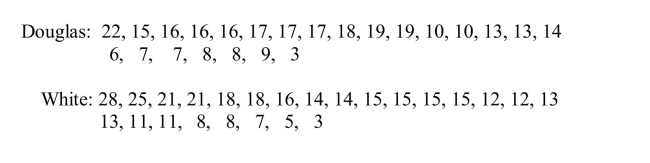 (a) Display these data using a comparative (back-to-back) stem-and-leaf plot. Usethe stems shown below, and be sure to include all information needed to comparethe two distributions.
 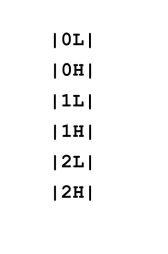 (b) Compare the distributions in part (a). What differences and similarities do youobserve in the two distributions?
(c) When Mountain Chicadees are sampled to assess their health, they are captured inmist-nets, which are set to capture the birds at different heights. The mist nets areabout 2 meters high, and directions must be given to the persons who set up thenests so that the mist-nets are positioned to capture the most birds. Based on thedata from part (a) and your display in part (b), write a short paragraph describingthe appropriate mist-net height in a forest region of Douglas firs and for a forestregion of White firs.
Correct Answer:

Verified
a) Foraging heights of Mountain Chickade...View Answer
Unlock this answer now
Get Access to more Verified Answers free of charge
Correct Answer:
Verified
View Answer
Unlock this answer now
Get Access to more Verified Answers free of charge
Q18: Hoofed animals such as cattle and sheep
Q19: The average circumferences (distances around) in mm
Q20: A unimodal set of data is one
Q21: Marine biologists have reported the discovery of
Q22: A numerical variable is continuous if it's
Q24: A time series plot is a graph
Q25: The Des Moines Register article in <img
Q26: The Des Moines Register article in YearsExp
Q27: In a histogram, class intervals are required
Q28: When using histograms to compare groups of