Essay
A very large study of college students' study habits found that the time (in hours) thatfreshmen study each week is approximately normal with mean 24 hours and standarddeviation 8 hours. Consider random samples of size 16 from the population of freshmen.
a) On the axes below, sketch curves representing the distribution of the original populationand the sampling distribution of for samples of size n =16 . Be sure to indicate whichcurve is which. What are the mean and standard deviation of the sampling distributionof ?
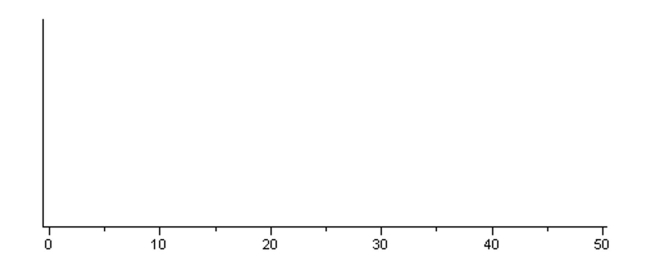
b) What is the probability that a sample of size n = 16 from this population would result ina sample mean greater than 30 hours?
The study of college freshmen also asked about the students' time spent playing video games.Suppose that the population relative frequency histogram for time spend playing video games isas shown below. The mean amount of time spent playing video games was 0.8 hours per week.Relative Frequency 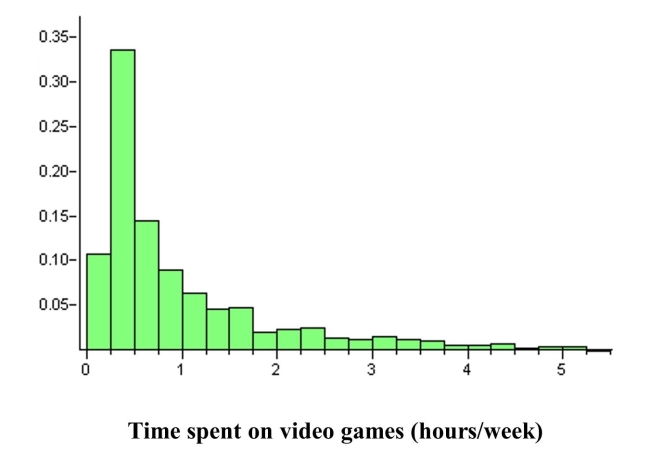
c) Suppose you were to take a random sample, n = 4, from this population of freshmen andask them how much time they spent playing video games per week. Describe the shape,center, and spread of the sampling distribution of , as compared to the populationdistribution.
Correct Answer:

Verified
Correct Answer:
Verified
Q2: In a few sentences, describe the difference
Q3: <img src="https://d2lvgg3v3hfg70.cloudfront.net/TB5309/.jpg" alt=" " class="answers-bank-image d-block" rel="preload"
Q5: The department of natural resources classifies a
Q7: Give as much information as you can
Q8: Logging activity in forests is thought to
Q10: Give as much information as you can
Q11: <img src="https://d2lvgg3v3hfg70.cloudfront.net/TB5309/.jpg" alt=" " class="answers-bank-image d-block" rel="preload"
Q16: All other things being equal, choosing a
Q23: If the null hypothesis is not rejected,
Q28: A t curve is bell-shaped like the