Essay
The State Fisheries Department wishes to stock the Styx River with fish, and would like thespecies to not only survive but thrive. The "substrate" (pebble size at bottom) of a river is animportant determinant of the quality of spawning habitat. Unknown to the Fisheriesofficials, the pebble diameters in the Sty x River are approximately normally distributed witha mean of 24 mm, and a standard deviation of 8 mm. Fisheries officials will select a randomsample of pebbles in an attempt to estimate the average pebble size.
a) On the scale below, sketch two curves, one representing the distribution of the originalpopulation and the other the sampling distribution of for a sample of size n =16 . Besure to indicate which curve is which. What are the mean and standard deviation of thesampling distribution of ?
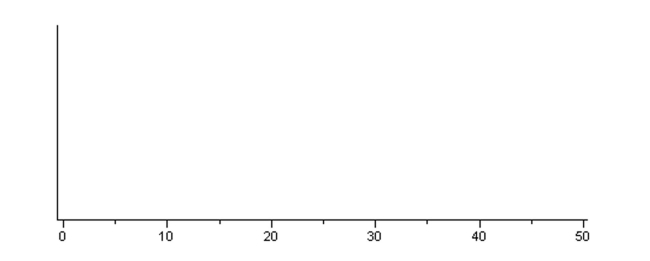
b) What is the approximate probability that a sample of n = 16 from this population wouldresult in a sample mean greater than 30 mm?
The graph below is a relative frequency histogram of the lengths of the gentle Hecate fish in theStyx River, as recorded during a large fish tagging survey. You can assume that this histogramrepresents the population of fish lengths.Relative Frequency 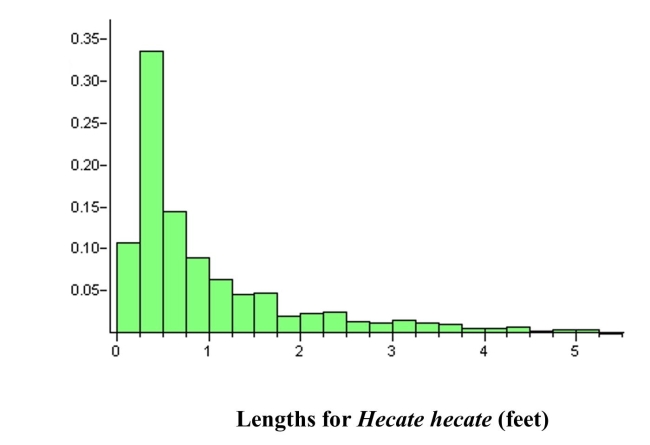
c) Suppose you were to take a random sample, n = 4, from this population of fish andmeasure their lengths. Describe the shape, center, and spread of the samplingdistribution of , as compared to the population distribution.
Correct Answer:

Verified
Correct Answer:
Verified
Q10: Give as much information as you can
Q11: <img src="https://d2lvgg3v3hfg70.cloudfront.net/TB5309/.jpg" alt=" " class="answers-bank-image d-block" rel="preload"
Q12: When the hatching of young geese is
Q13: A boat manufacturer claims that a particular
Q13: A statistic is a characteristic of a
Q16: Consider sampling from a normal population
Q18: <img src="https://d2lvgg3v3hfg70.cloudfront.net/TB5309/.jpg" alt=" " class="answers-bank-image d-block" rel="preload"
Q19: We say that the result of a
Q21: When performing hypothesis tests, there are assumptions
Q28: A t curve is bell-shaped like the