Multiple Choice
The graph below shows the percentage of students enrolled in the College of Engineering at State University. Use the graph to
answer the question. 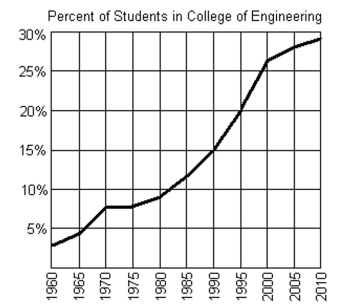
-If f(x) = 15%, what year is represented by x?
A) 1985
B) 1990
C) 1980
D) 1995
Correct Answer:

Verified
Correct Answer:
Verified
Related Questions
Q80: Express the interval in set builder
Q81: Use the graph to find the indicated
Q82: Use the vertical line test to determine
Q83: Decide whether the relation is a
Q84: Find the indicated function value.<br>- <span
Q86: Find the indicated function value.<br>- <span
Q87: Find the indicated function value.<br>- <span
Q88: Find the domain and range.<br>- <span
Q89: Find the domain of the function.<br>-
Q90: Use the vertical line test to determine