Multiple Choice
The graph below shows the percentage of students enrolled in the College of Engineering at State University. Use the graph to
answer the question. 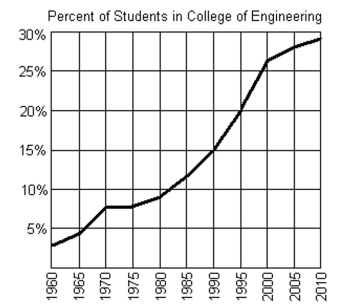
-Between what two years is the difference in function values equal to 5%?
A) between 1995 and 2000
B) between 1990 and 1995
C) between 1980 and 1985
D) between 1970 and 1975
Correct Answer:

Verified
Correct Answer:
Verified
Q8: Find the indicated function value.<br>- <span
Q9: Decide whether the relation is a
Q10: Find the indicated function value.<br>- <span
Q11: Use the vertical line test to determine
Q12: Use the vertical line test to determine
Q14: Express the interval in set builder
Q15: Decide whether the relation is a
Q16: Find the domain of the function.<br>-
Q17: For the pair of functions, determine
Q18: Express the interval in set builder