Multiple Choice
Graph the equation. Find seven solutions in your table of values for the equation by using integers for x, starting with -3
and ending with 3.
-A census was taken to determine the median annual income for residents of a selected region of the United States, by level of education. The given polynomial models describe the median annual income for men, M, and
For women, W, who have completed x years of education. Shown in a rectangular coordinate system are the
Graphs of the polynomial models. Identify the median annual income for a man with 10 years of education as a
Point on the appropriate graph. 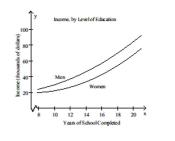
A) (10, 41,240)
B) (10, 58,431)
C) (10, 29,846)
D) (10, 22,161)
Correct Answer:

Verified
Correct Answer:
Verified
Q54: Identify the polynomial as a monomial,
Q55: Use a vertical format to find
Q56: Find the product.<br>- <span class="ql-formula" data-value="\left(
Q57: Use a vertical format to find
Q58: Find the product.<br>- <span class="ql-formula" data-value="x
Q60: Identify the polynomial as a monomial,
Q61: Solve the problem.<br>-Find the area of
Q62: Add the polynomials.<br>- <span class="ql-formula" data-value="\left(
Q63: Multiply by using the rule for
Q64: Find the product.<br>- <span class="ql-formula" data-value="(