Multiple Choice
Graph the equation. Find seven solutions in your table of values for the equation by using integers for x, starting with -3
and ending with 3.
-A census was taken to determine the median annual income for residents of a selected region of the United States, by level of education. The given polynomial models describe the median annual income for men, M, and
For women, W, who have completed x years of education. Shown in a rectangular coordinate system are the
Graphs of the polynomial models. Identify the median annual income for a woman with 13 years of education as
A point on the appropriate graph. 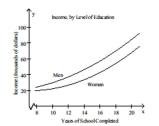
A) (13, 41,504)
B) (13, 56,696)
C) (13, 29,874)
D) (13, 78,234)
Correct Answer:

Verified
Correct Answer:
Verified
Q95: Use the FOIL method to find
Q96: Multiply the monomials.<br>- <span class="ql-formula" data-value="\left(
Q97: Use a vertical format to find
Q98: Use a vertical format to find
Q99: Subtract the polynomials.<br>- <span class="ql-formula" data-value="\left(
Q101: Multiply the monomials.<br>- <span class="ql-formula" data-value="\left(
Q102: Use a vertical format to subtract
Q103: Perform the indicated operations.<br>-Subtract -6 - 2x7
Q104: Graph the equation. Find seven solutions
Q105: Find the area of the shaded