Multiple Choice
The graph shows the monthly revenue in millions of dollars of a growing company after the company doubled its advertising. Use the graph to solve the problem. 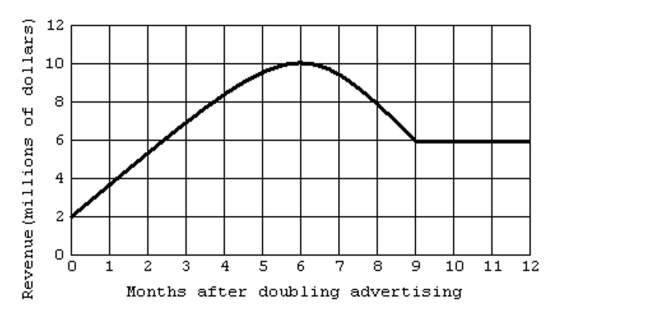
-What is the y-intercept?
A) 1
B) 4
C) 2
D) 6
Correct Answer:

Verified
Correct Answer:
Verified
Related Questions
Q94: Graph the linear equation in two
Q95: Determine whether the lines through each pair
Q96: Graph the linear equation in two
Q97: Find the y- and x-intercepts for
Q98: Plot the given point in a
Q100: Solve.<br>-A tent has the dimensions shown
Q101: Find the y- and x-intercepts for
Q102: Write the sentence as a linear
Q103: Find the slope of the line
Q104: Determine whether the lines through each pair