Multiple Choice
The pie chart below shows the number of pizzas consumed by college students in a typical month. Use the chart to
answer the question. 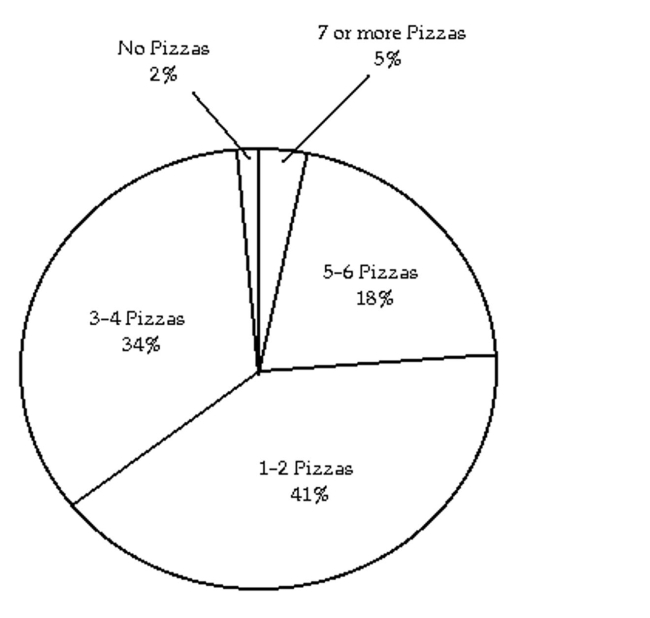
-What percent of college students consume no pizzas in a typical month?
A) 34%
B) 2%
C) 5%
D) 18%
Correct Answer:

Verified
Correct Answer:
Verified
Q106: Solve the equation using the multiplication
Q107: Use a formula for perimeter or
Q108: Solve the equation using both the addition
Q109: Solve the problem.<br>-The time it takes to
Q110: Solve the equation.<br>- <span class="ql-formula" data-value="7
Q112: Solve the equation.<br>- <span class="ql-formula" data-value="x
Q113: Solve the equation using the multiplication property
Q114: Solve the equation.<br>--19 = b - 11<br>A)
Q115: Solve the equation.<br>- <span class="ql-formula" data-value="-
Q116: Solve the equation.<br>- <span class="ql-formula" data-value="\frac