Multiple Choice
The pie chart below shows the number of pizzas consumed by college students in a typical month. Use the chart to
answer the question. 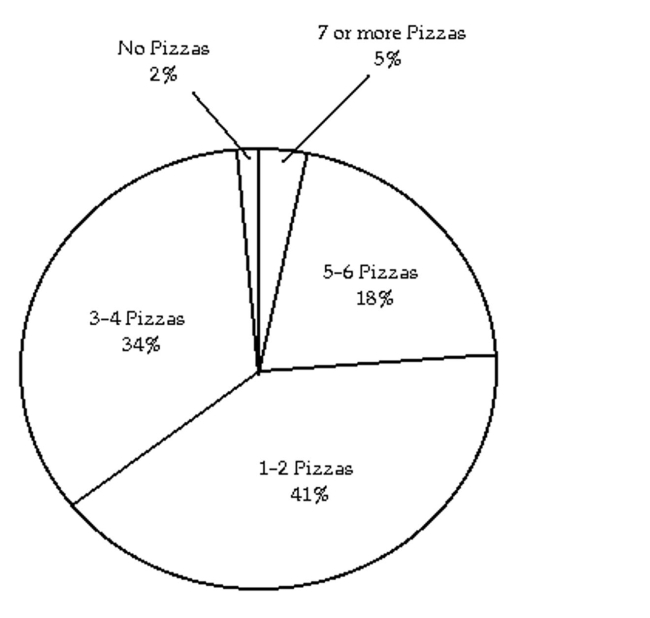
-What percent of college students consume 4 pizzas or less in a typical month?
A) 82%
B) 75%
C) 43%
D) 77%
Correct Answer:

Verified
Correct Answer:
Verified
Related Questions
Q98: Solve the equation using the multiplication
Q99: Let x represent the number. Write the
Q100: Solve the equation.<br>-3(y + 3) = 4(y
Q101: Solve the problem.<br>-If 5 is increased to
Q102: Solve the equation using both the addition
Q104: Solve the equation.<br>-a - 13 = -2<br>A)
Q105: Use a formula for perimeter or
Q106: Solve the equation using the multiplication
Q107: Use a formula for perimeter or
Q108: Solve the equation using both the addition