Multiple Choice
The pie chart below shows the number of pizzas consumed by college students in a typical month. Use the chart to
answer the question. 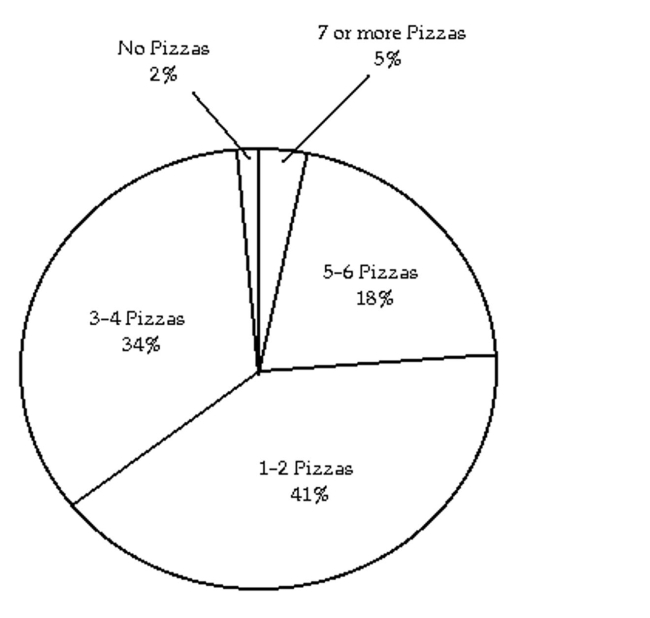
-If State University has approximately 25,000 students, about how many would you expect to consume 5-6 pizzas in a typical month?
A) 4500 students
B) 850 students
C) 8500 students
D) 450 students
Correct Answer:

Verified
Correct Answer:
Verified
Q138: Solve the equation.<br>--5a + 5 + 6a
Q139: Solve the equation.<br>-x + 5 = -18<br>A)
Q140: The pie chart below shows the number
Q141: Solve the equation.<br>- <span class="ql-formula" data-value="0.88
Q142: Solve the equation.<br>- <span class="ql-formula" data-value="\frac
Q144: Solve the equation.<br>--z = -5<br>A) {5}<br>B) {0}<br>C)
Q145: Solve the equation.<br>- <span class="ql-formula" data-value="0.02
Q146: Solve the equation using the multiplication
Q147: Solve the equation using both the addition
Q148: Solve the equation. Use words or