Multiple Choice
Solve the problem.
-The bar graph below shows a company's yearly profits from 2003 to 2011. Let an represent the company's profit, in millions, in year n, where n = 1 corresponds to 2003, n = 2 corresponds to 2004, and so on. 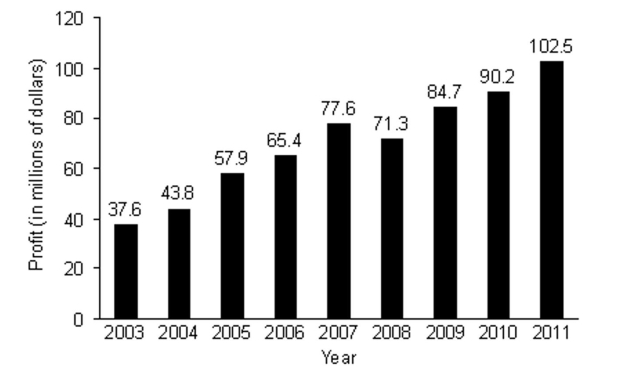
A) $505.8 million
B) $549.6 million
C) $167.9 million
D) $491.7 million
Correct Answer:

Verified
Correct Answer:
Verified
Related Questions
Q90: Write the first five terms of the
Q91: Write the first four terms of
Q92: Find the common ratio for the geometric
Q93: Use the partial sum formula to find
Q94: Express the sum using summation notation.
Q96: Use the formula for the general term
Q97: Find the common ratio for the
Q98: Write the first four terms of
Q99: Solve the problem.<br>-The population of a town
Q100: Write a formula for the general