Multiple Choice
The average number of prisoners in a county jail is modeled by y , where x is the number of years after 2000.
1. Graph this function from 0 to 30.
2. Approximate, to the nearest whole number, how many prisoners there will be in 2010.
3. Does this model indicate that the number of prisoners will increase or decrease from 2000 to 2030?
A) 1.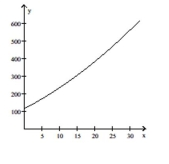
2. 233
3. increase
B) 1.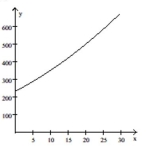
2. 351
3. increase
C) 1.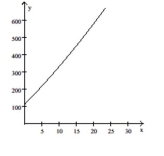
2. 233
3. increase
D) 1.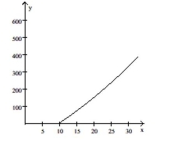
2. 333
3. increase
Correct Answer:

Verified
Correct Answer:
Verified
Q251: Solve the equation.<br>- <span class="ql-formula" data-value="|
Q252: Graph the function.<br>- <span class="ql-formula" data-value="f
Q253: Find the requested value.<br>- <span class="ql-formula"
Q254: Graph the quadratic equation on [
Q255: The number of mice in an
Q256: Determine if the vertex of the
Q258: A salesperson gets a commission of $800
Q259: Determine if the vertex of the
Q260: You are given a graph of
Q261: A study in a small town