Multiple Choice
Use the data shown in the scatter plot to determine whether the data should be modeled by a linear function.
-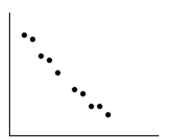
A) Yes, approximately linear
B) No, data points do not lie close to a line
C) Yes, exactly linear
Correct Answer:

Verified
Correct Answer:
Verified
Related Questions
Q37: Solve the double inequality.<br>- <span class="ql-formula"
Q38: Translate the sentence to an algebraic inequality.<br>-A
Q39: Solve the equation for y.<br>-An average score
Q40: The graph of a certain function
Q41: The table below gives the quantity
Q43: Solve the formula for the specified
Q44: Solve the equation for y.<br>-Suppose the
Q45: Find the linear function that is
Q46: Solve the inequality graphically. Give the
Q47: Write the best-fit linear model for