Multiple Choice
Construct a scatter plot of the data in the table.
- 
A) 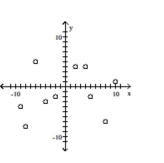
B) 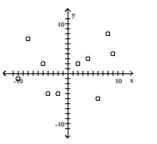
C) 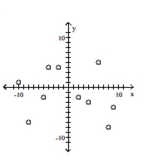
D) 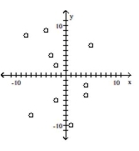
Correct Answer:

Verified
Correct Answer:
Verified
Related Questions
Q127: The graph of a certain function
Q128: The graph of a certain function
Q129: Translate the sentence to an algebraic inequality.<br>-During
Q130: Solve the equation using graphical methods.
Q131: Solve the system of equations by
Q133: Solve the system of equations by
Q134: Solve the system of equations by
Q135: Without graphing, determine whether the following
Q136: Solve the equation.<br>- <span class="ql-formula" data-value="\frac
Q137: To find the number of units