Multiple Choice
Construct a scatter plot of the data in the table.
- 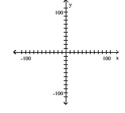
A) 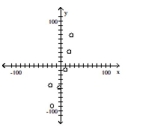
B) 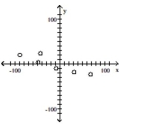
C) 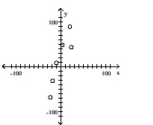
D) 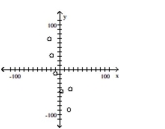
Correct Answer:

Verified
Correct Answer:
Verified
Related Questions
Q170: Solve the equation.<br>- <span class="ql-formula" data-value="\frac
Q171: Solve the inequality and draw a
Q172: Solve the inequality graphically. Give the
Q173: Find the zero of f(x).<br>- <span
Q174: To find the number of units
Q176: Write the best-fit linear model for
Q177: To find the number of units
Q178: The graph of a certain function
Q179: Provide an appropriate response.<br>-A set of
Q180: Find the linear function that is