Multiple Choice
Construct a scatter plot of the data in the table.
- 
A) 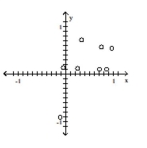
B) 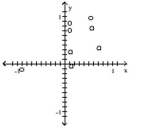
C) 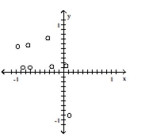
D) 
Correct Answer:

Verified
Correct Answer:
Verified
Related Questions
Q152: Write the best-fit linear model for
Q153: Solve the equation.<br>- <span class="ql-formula" data-value="-
Q154: To find the number of units
Q155: Translate the sentence to an algebraic
Q156: The graph of a certain function
Q158: Without graphing, determine whether the following
Q159: Without graphing, determine whether the following
Q160: Solve the equation using graphical methods.
Q161: Without graphing, determine whether the following
Q162: Solve the equation for y.<br>- <span