Multiple Choice
Write the best-fit linear model for the data.
-A study was conducted to compare the average time spent in the lab each week versus course grade for computer students. The results are recorded in the table below. The linear model for this data is , where is the number of hours spent in the lab and is grade on the test. Use this model to predict the grade of a student who spends 12 hours in the lab.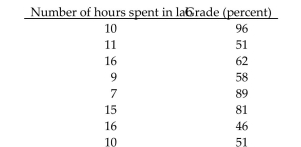
A) 68.7
B) 66.3
C) 62.3
D) 76.6
Correct Answer:

Verified
Correct Answer:
Verified
Q100: Provide an appropriate response.<br>-The double inequality
Q101: To find the number of units
Q102: Provide an appropriate response.<br>-True or Fal
Q103: Solve the double inequality.<br>- <span class="ql-formula"
Q104: Solve the equation.<br>- <span class="ql-formula" data-value="\frac
Q106: Find the linear function that is
Q107: Solve the equation using graphical methods.
Q108: Solve the equation.<br>- <span class="ql-formula" data-value="13
Q109: Write the best-fit linear model for
Q110: Write the best-fit linear model for