Multiple Choice
Suppose that the speed of a car, measured in miles per hour (mph) , is monitored for some short period of time after the driver applies the brakes. The following table and graph relate the speed of the car to the amount of
Time, measured in seconds (sec) , elapsed from the moment that the brakes are applied. 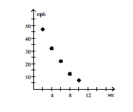 What general trend do the data reflect? In which of the time intervals does the speed change the most?
A) With increasing elapsed time, the speed decreases. The speed changes most during the time interval from 8 seconds to 10 seconds.
B) With increasing elapsed time, the speed decreases. The speed changes most during the time interval from 2 seconds to 4 seconds.
C) With increasing elapsed time, the speed increases. The speed changes most during the time interval from 2 seconds to 4 seconds.
D) With increasing elapsed time, the speed increases. The speed changes most during the time interval from 8 seconds to 10 seconds.
Correct Answer:

Verified
Correct Answer:
Verified
Q126: Decide if the function is linear.<br>-
Q127: Find the x- and y-intercepts of
Q128: Find the slope of the line
Q129: A customer's savings account number n given
Q130: Write the slope-intercept form of the
Q132: Graph the function with a graphing
Q133: Determine whether the given relationship defines a
Q134: Write the equation of the line
Q135: Find the domain of the function.<br>-
Q136: Decide whether or not the arrow diagram