Multiple Choice
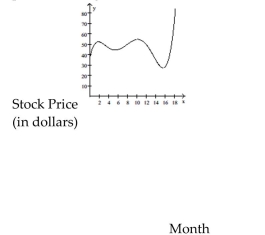
The following graph shows the stock price of a new internet company over the first 18 months after the initial public offering of its stock.  How many months was the stock price $40 during the initial 18 month period?
A) 1 month
B) 3 months
C) 2 months
D) 4 months
Correct Answer:

Verified
Correct Answer:
Verified
Related Questions
Q229: Find the x- and y-intercepts of
Q230: <img src="https://d2lvgg3v3hfg70.cloudfront.net/TB6590/.jpg" alt="
Q231: The profit for a product is
Q232: Determine whether or not the relationship
Q233: Determine whether or not the function
Q235: Determine whether or not the function
Q236: Find the slope of the line
Q237: Graph the function with a graphing
Q238: The number of shares s of a
Q239: A cable TV company charges