Multiple Choice
The following graph shows the stock price of a new internet company over the first 18 months after the initial public offering of its stock. 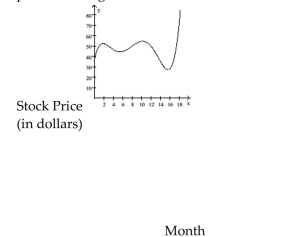 Approximately in which month(s) did the stock price reach $70?
A) The 18th month
B) The 10th and 18th months
C) The 2nd and 10th months
D) The price never reached $70.
Correct Answer:

Verified
Correct Answer:
Verified
Q8: Decide whether or not the set
Q9: Write the equation of the line
Q10: Use a graphing utility to graph
Q11: The percent p of high school
Q12: Graph the equation.<br>- <span class="ql-formula" data-value="4
Q14: Determine if there is a linear
Q15: Determine whether the given relationship defines a
Q16: Decide whether or not the set
Q17: Provide an appropriate response.<br>-Explain the process used
Q18: The forearm length in centimeters, A,